This project started out as a tiny feature intended for our DataOps cloud BI platform, Holistics.io. Our interns helped develop dbdiagram.io, to help our customers visualize their own database relationships as diagrams. This is meant as a quick and simple tool designed for data analysts and developers, to help them design database diagrams by just using their keyboard.
Inspired from Product-led Growth approach and Free Tool - SKU Generator of Lucas, my friend from TradeGecko, we found an opportunity to contribute to the data community by releasing it as a free tool, as well as a sustainable source of traffic for our company.

Within the first 2 months, dbdiagram.io got 20,000+ users (it has reached 80K now) and generated 2,500+ leads to Holistics. Managing to launch a product alone couldn’t have led to this success, but it’s also about building a market-fitting product. And I think it might be useful to share this amazing experiment with you, the makers or entrepreneurs who are always eager to learn and build.
In the first part, I’m going to share with you how we built dbdiagram.io from scratch.
Read more
- A Database Diagram Designer Built for Developers and Analysts
- Part 2: How did we manage to launch dbdiagram.io to 200,000 users with 0 dollars spent on marketing budget
TL;DR
- The story behind
- Defining the objectives
- Focusing on delivering value by defining problems and target audience using Jobs-to-be-Done framework
- Doing research on market, SEO, and competition
- Crafting message
- Creating wireframes and mockups
- Breaking the job stories into tasks and prioritizing them
- Implementing data tracking
- Automate feedback and support process
- Publishing public roadmap and release notes
- Keep iterating on the product
How It Got Started
- We had just hired 2 software engineer interns 👨🎓👨🎓
- However, it turned out the main product was too complex for interns to get started with 🤔
- In the meantime, we were working on a feature named Data Models, which allows our users to visualize their database and get insights via drag-and-drop.
- One important sub-feature of Data Models is the ability to visualize database relationships. We found that an individual database visualizer would be interesting for our interns to research and work on.
- Just a week later, our interns surprised us by demonstrating the 1st version, the diagrams were able to be perfectly generated from JSON files. It was so cool that it made us wonder ourselves, what if we allowed users to edit the diagrams directly, it would become a super helpful tool to visualize and design databases. Thus, we decided to turn it into a standalone product.
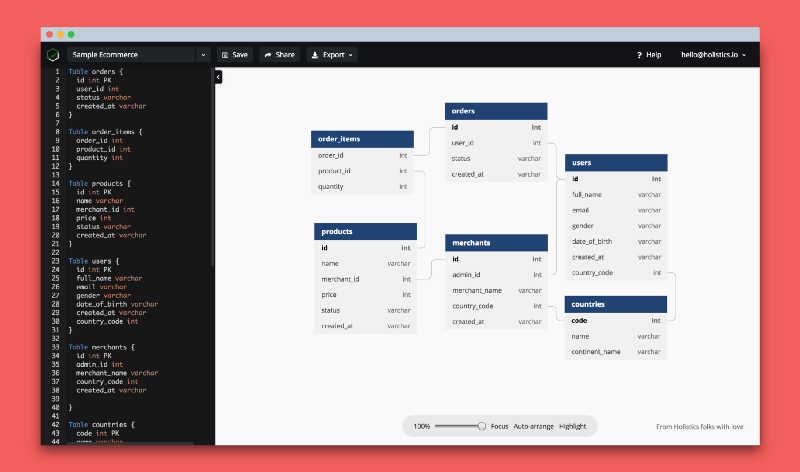
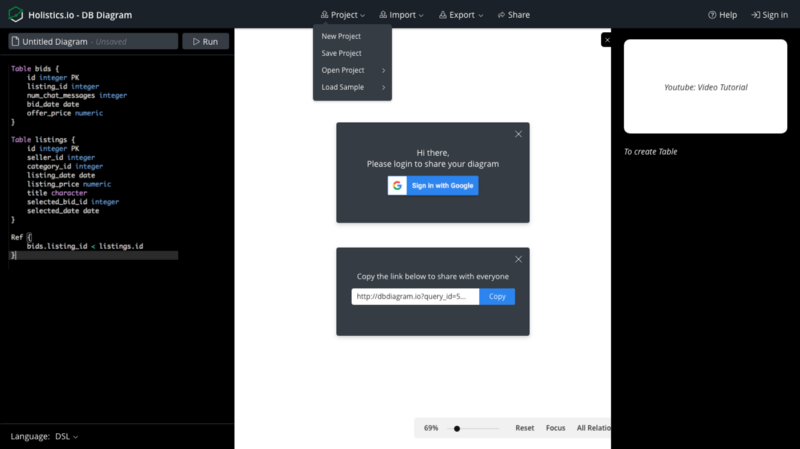
The 1st version of dbdiagram.io, looks exactly like a student project!
- We started planning for it while our interns continued developing more features to make it a standalone product, such as Editing the code to generate diagrams, Sign Up/Sign In, Save Diagrams, Share Diagrams…
- We then proudly released the first MVP after 2 months of development.
- It becomes a memorable project which helps them learn D3JS, NodeJS, and gain real Product Development experience.
Start with a Philosophy
Delivering Value First
- Delivering Value with Profit = Good Business
- Delivering Value without Profit = Charity
- Not Delivering Value with Profit = Are you phishing?
- Not Delivering Value without Profit = Are you stupid?
It’s not only for products, but that’s also our principle for everything, whether it’s an email or a tweet, it has to start with delivering clear value to its audience.
With that obsession for delivering value, we didn’t even create a homepage at first, so that when there was a user visiting dbdiagram.io, we navigated them to the editor directly, so he/she could start drawing diagram immediately without any friction.
Later down the track we found that hurts our SEO 😅, therefore, now you can see a simple landing page at dbdiagram.io which has a single purpose that communicates the value of the product.
It’s a Product, but not a Startup
It’s not a startup trying to exit or become the next unicorn, it’s just simply a tiny product that delivers value.
Keeping aware of this helps us determine the areas to focus on which are product functionalities and the experience, and not how to monetize it.
How We Built It

#1 Why this - Define Your Objectives 🎯
Before firing up any product, defining clear objectives must always be the 1st task in the to-do list, since it’s the reason and motivation for the whole thing you are doing.
To define the objectives, not only from the beginning, these questions should be revisited all the time
- Why would you want to do this?
- What would you want to achieve?
- How would you balance between the business value and user value?
With dbdiagram.io, we split the objectives into 2 main categories
For Holistics - Business Value:
- A great source to increase our brand awareness and get leads from the community.
- An inspiration for the team. Since we had been spending all the energy on the main product, a B2B SaaS which is trying solve giant problems in the crowded BI industry, it’s a good time for us to take a break and get the motivation from contributing something.
- Experiment and practice with minimal risk. It’s a great way for us to learn how to build products and do marketing better for the upcoming features of Holistics.
For Data Community - User Value:
- A free tool to help developers and analysts design database easily.
#2 Define the Target Audience 👷👨🏫👩🎓👩💻🧛
The 2nd important thing to do, defining who you are trying to make their lives better with your product.
Never underestimate it, it will be your master overriding focus that guides you on how to design the product (Product Experience) as well as where to find the users (Sales & Marketing).
However, you don’t have to follow it blindly, the user segments you benefit could change over time, depending on how the market reacts and how your product grows.
For example, at first, we thought, “It’s about database diagrams, let’s start with Data Analysts and Data Engineers“.
But in fact, they are not that excited, most of them are professionals in their fields and already found themselves the tools for life.
One afternoon, I went to a coffee shop with my friend, a web developer, was about to start his new project. While he was looking for a tool to design his database, I shared dbdiagram.io with him as an aside.
💡
That was a lightbulb moment in my life, Indie and Web Developers must have been the true key target audience from the beginning. A lot of things changed from that discovery, we focused more on developers’ channels, used the new tagline “Database Diagram Designers Built for Developers and Analysts“. Till now, 70% of our users are developers.
Later on, through their feedback, we found more interesting profiles which also find dbdiagram.io useful such as Business Analysts, Teachers, Students — which expands the number of channels we are able to reach.
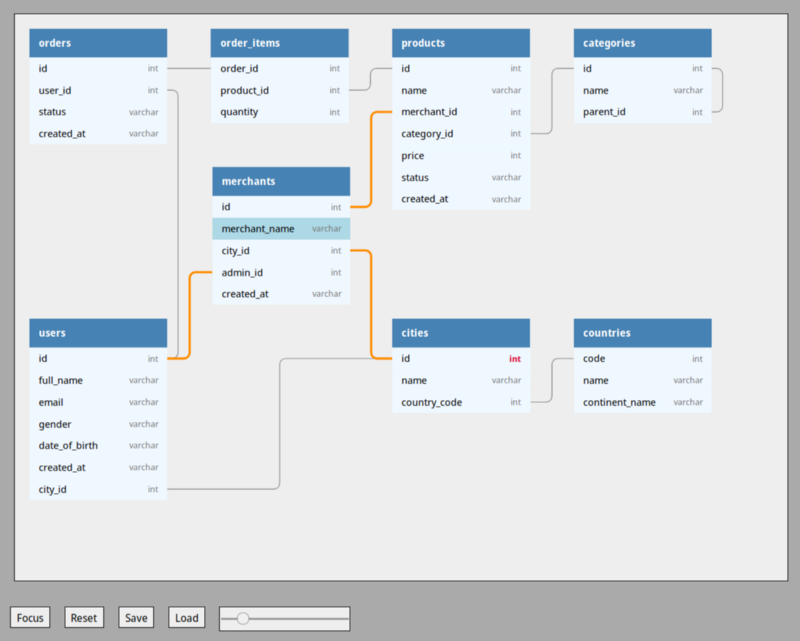
A teacher uses dbdiagram.io for his class
Research (Market - SEO - Competition…) 🔍
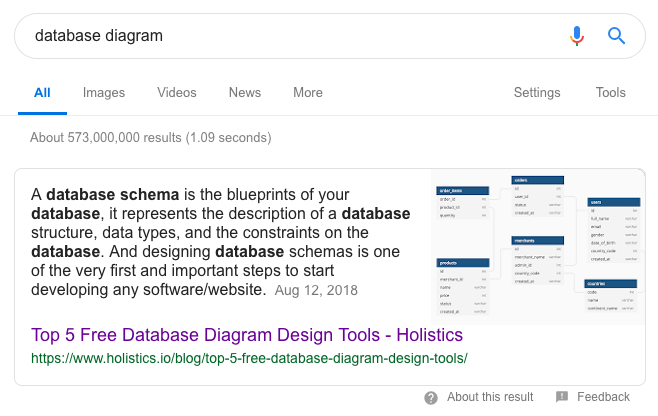
You might think this product is a Database Designer, sadly, there might be not many people searching for it, or it’s too competitive to be ranked on the internet.
Whatever you think your product is, it could be totally different in others’ minds. It’s necessary for minds to be aligned on this, otherwise, your product will remain an undiscovered treasure.
This can easily be achieved by doing some small research to grok what people think when they’re typing in the search box on the internet.
We used SerpStats and Google Keyword Planner for that. And we found the truth that people search for Database Diagram, Database Diagram Tools, Database Design Tools… much more than Database Designer. So we decided to focus our content around those keywords, and we got really high positions when you search for Database Diagram.
The keywords you chose should not be static as well, they will evolve over time with the target audience. Yet, the right strategy will give you a good boost, which I will share more in the next part.
More than that, the research also led us to how we named the product. The team’s capacity for a side-product is limited, we knew we wouldn’t have much time to educate the market about this product, so let’s go with a self-explanatory name 👉 dbdiagram.io
Work Backwards, Define 1-line Pitch 📰
dbdiagram.io is a quick and simple tool built for Developers and Analysts to draw database relationship diagrams quickly using just your keyboard.
So it helps you to design database, it’s quick, it’s simple, it’s for Developers and Analysts, not for a Non-tech guy. That one short paragraph is our north star to keep us on the right track.
Define Job Stories 📒
Keep in mind that a Job-to-be-Done describes the “better me.” It answers the question, “How are you better since you started using this [product]?”
By focusing on making users’ lives better, Job-to-be-Done (JTBD) framework really changed how I look into any product. It helps us deeply understand WHY customers actually want something, in order to build up the better WHAT and HOW so we can help the customers to achieve their goals.
What is Jobs to be Done (JTBD)?
8 Things To Use in “Jobs-To-Be-Done” Framework For Product Development
Some main Job Stories we defined for dbdiagram.io:
- When I present to my customers about new software or a database structure, I want to have a database diagram quickly, so my customers can easily understand the whole idea.
- When I start developing new software, I want to draft a database structure as quickly as possible, so I can jump immediately into coding stuff.
- When I teach my students about database structure, I want to have some sample database schemas, so my students can easily understand the concept of the database schema.
Create Wireframes/Mockups 🎨
Buildings start with Blueprints, Software start with Wireframes.
A wireframe might take a few hours to update while coding would take days or weeks. It helps you get everybody on the same page and start brainstorming immediately. So don’t just jump right into the code, draw something to discuss first.
Another power I discovered from the wireframes over years, they also help motivate your team. Just after a few hours of designing, it might not look exactly what you will have in the future, but it has the ability to get anyone in your team to grasp your vision easily, which is hard to communicate in words.
Break Down Job Stories into Doable Tasks 💾
One last step before jumping into the first line of code, is turning your job stories into doable tasks for your team along with priorities to manage along the way.
Since the backlog will soon be filled to thousands of tasks from ideas and feedback, only ruthless prioritization can save your day.
We use Asana and a simple prioritization framework, for example:
P1 - Users can’t live without
- Able to create tables/relationships from the editor
- Able to signup/login
- Able to save the diagram
P2 - Must have
- Able to share
- Able to drag from fields to fields to create relationships
- Able to export to SQL
P3 - Should have
- Able to import from PostgreSQL, MySQL, Rails Schemas
- When double click on table header, navigate to its definition
P4 - Nice to have
- Work collaboratively
- Dark/Light Mode
- Etc…
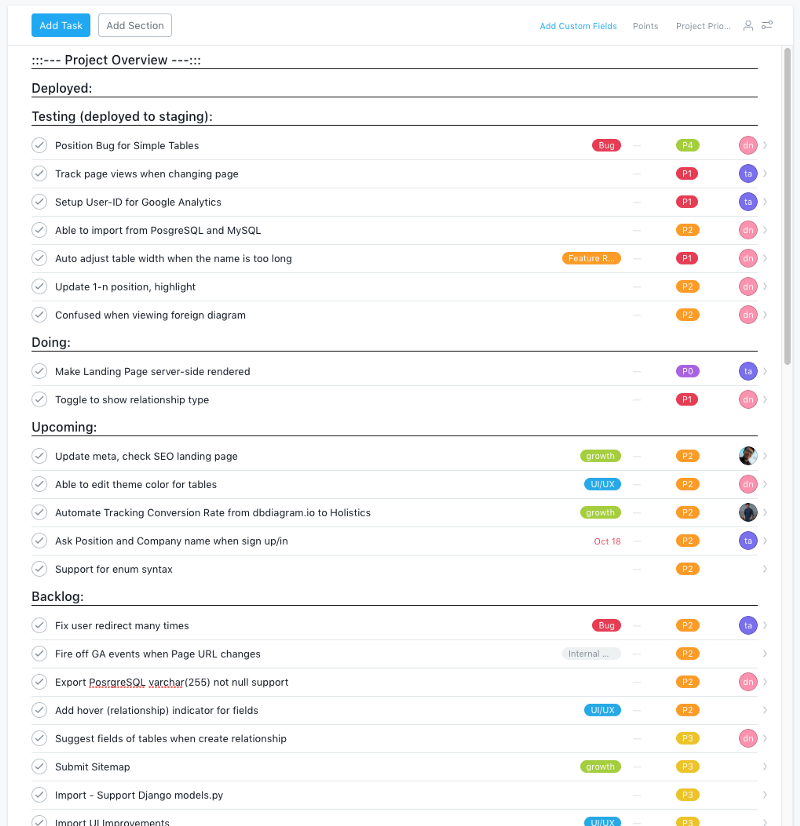
A well-prioritized project will always let you know what are the right things to do next, instead of creating capacity overload by doing non-value adding tasks.
Prioritization needs to be done ruthlessly, however, it’s not easy as it seems, it takes time to learn and practice, this is one of my favorites articles about prioritization in product management, do check it out Ruthless Prioritization
Note: If your Job Stories are complicated enough, do prioritize them as well.
Analytics 📊
In the early stages of a product, it could be overwhelming if you try to implement a whole event tracking system. However, knowing your key metrics is a prerequisite for success, it let you know whether your product is growing or not, and we chose The Number of Diagrams created as the north-star metric of dbdiagram.io.
We simply just implemented Google Tag Manager, Google Analytics and use Holistics for generic analytics purposes so far.
We will dive into more details about how we track and measure performance in the next part.
Implement a Feedback System
At the end of the day, what you are doing is to deliver value to your customers, and asking for their opinion about the experience they have with your product will reflect this. Do it in a proper way, and it will not only become the most powerful resource for business decisions but also help build up their trust.
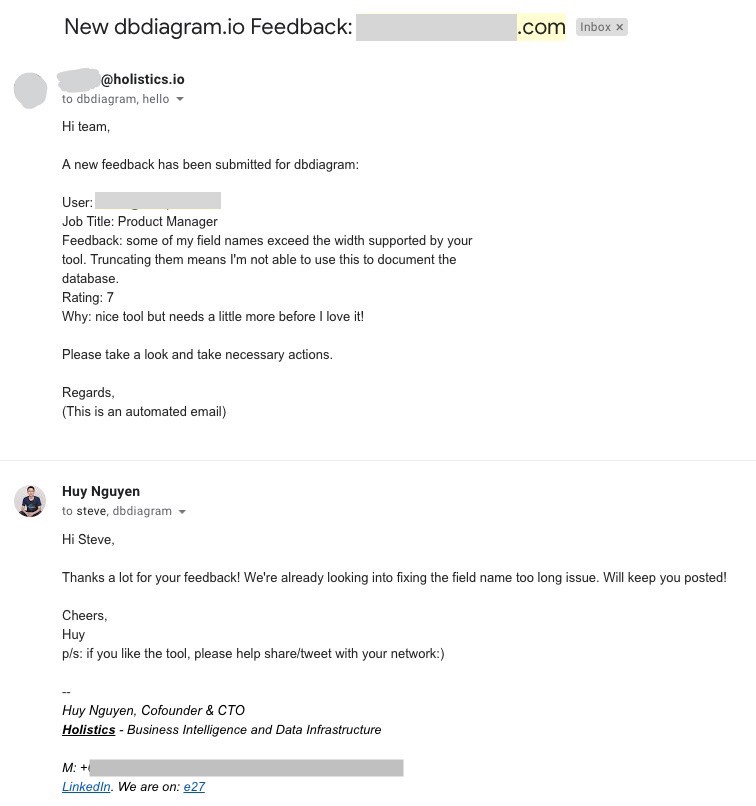
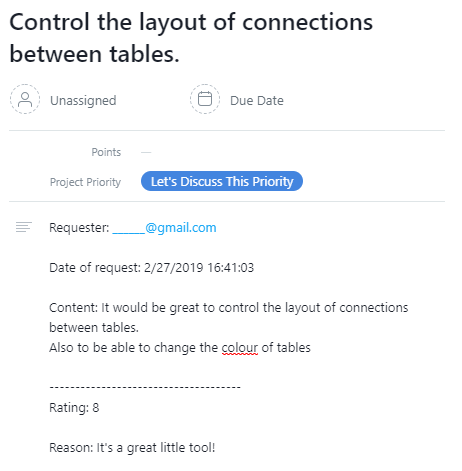
Yet collecting feedback easily become exhausting if there is too much friction. With the minimum effort, we automated the whole process using a simple Google Form to collect feedback and some Zapier integrations.
- Our Google Feedback Form: https://goo.gl/forms/88AmYOyiIiTuFuzG3
- Google Form + Twitter + Slack: So our team is always aware of the latest feedback in real-time
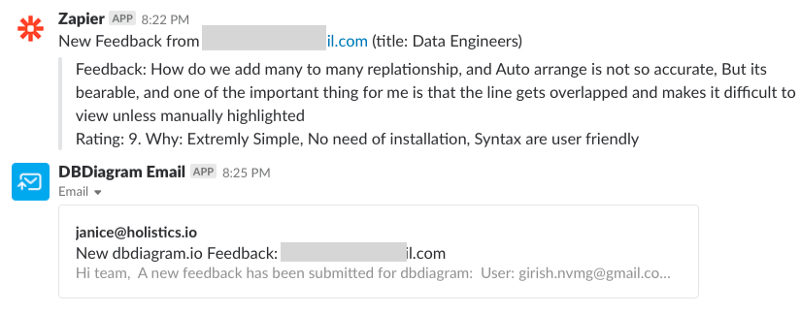
- Google Form + Mail Box: Respond to our customers immediately right from our inbox.
- Google Form + Asana: Create an Asana task for each feedback message
Public Roadmap and Release Notes
A good listener knows how to respond.
Public Roadmaps and Release Notes are a transparent way to communicate and keep your customers up to date on new features or improvements, which also empowers and treats them as the true companions in your journey.
Friction again should be eliminated in these kinds of recurring work, so we minimized the effort by spending 5 minutes to set this up via noting.io, included it into our homepage and the result is incomparable, it lets our users know not only what happened but also what to expect next. The frequency of the updates tells them how much we care about this product and why they should trust us.
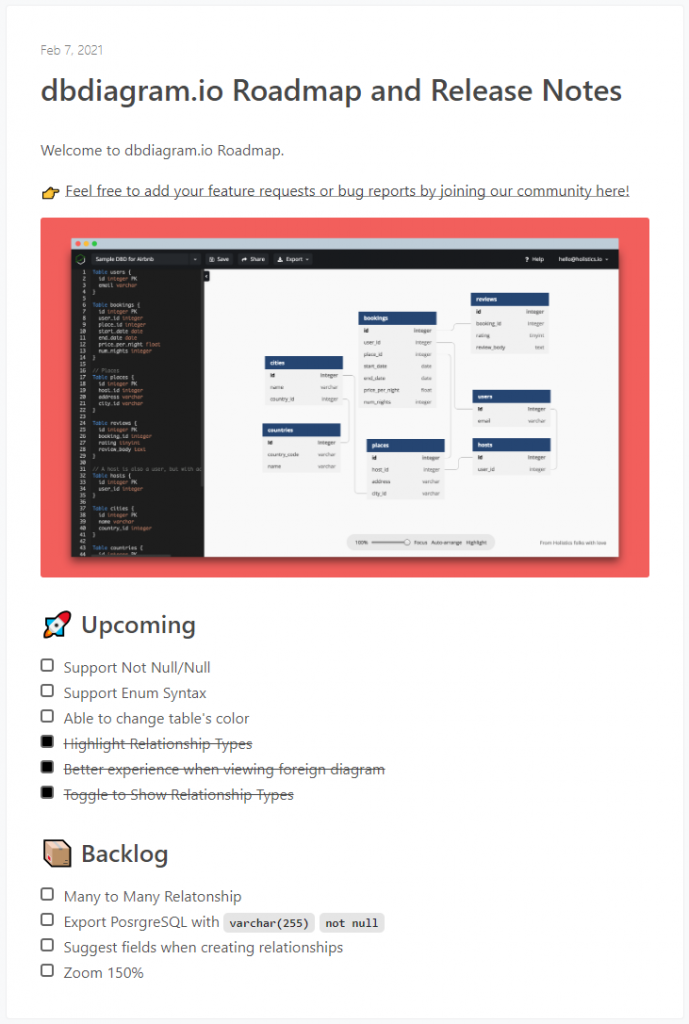
Why should you have a Public Roadmap and how to build it
Keep Learning and Iterating 😍
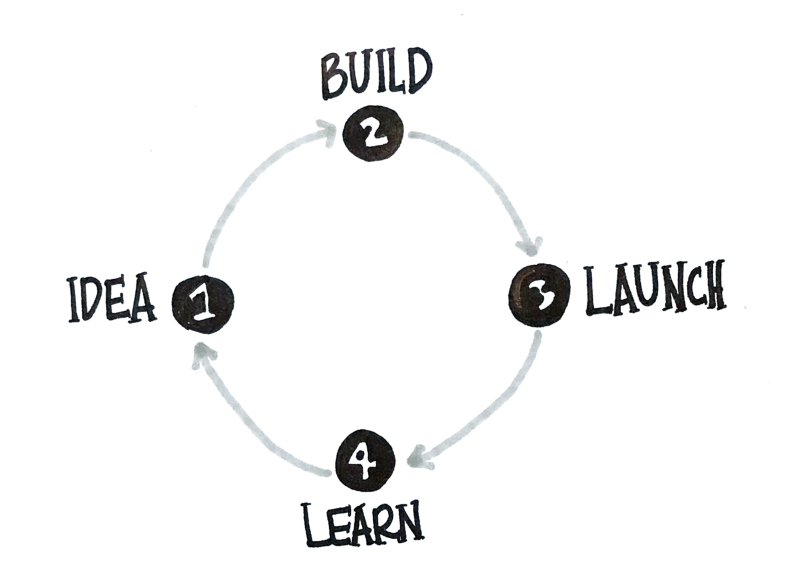
Focus on the value with the minimum effort to learn and iterate on it as soon as possible
Whatever you do, defining Target Audiences, Job Stories or designing User Experience, everything is just your assumption, until there are people who actually use it.
Don’t waste too much time on your assumptions, follow the lean principles, launch as soon as possible, get feedback as fast as you can, use it wisely to improve your product, and repeat. That way, you will know what are the most valuable things for users to do next and reduce the risk you are going to take.
Ps: Don’t forget to write them all down into documents, so your team can easily follow and keep up with you.
To be continued…
I’m a Product Manager at Holistics, the team behind dbdiagram.io. I’m still working on the 2nd part of this post on how we managed to launch dbdiagram.io. If you find it interesting, please follow me for the next updates 😊
Finally, a big thank to Nguyen Nhat Tai and Dung Nguyen Viet, our awesome interns, for making this happen 🤟
Part 2:
Launch dbdiagram.io to 200,000 Users with 0 Dollars Spent on Marketing Budget
Be the first to reply